من ابزار کار Fibonacci Retracement میشناسم
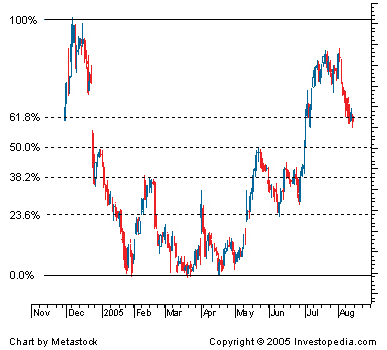
فیبوناچی ریتریسمنت ساده ترین و کاربردی ترین ابزار از گروه خطوط فیبوناچی ها می باشد. عموما زمانی که بازار در روندی خاص حرکت می کند در بازه هایی تمایل به بازگشت و تصحیح نسبت به قیمت های قبلی دارد اما پس از مدتی تمایل به ادامه روند غالب پیدا می کند. در یک روند صعودی درصدهای تصحیح بازگشت روند در جهت روند صعودی قبل، به ترتیب درصدهای 23.6 – 38.2 – 50 – 61.8 و 100 درصد می تواند باشد.
همانطور که در شکل دیده می شود در یک روند نزولی، خطوط 38.2، 50 و 61.8 برای قیمت حکم رزیستنس را داشته و از ادامه روند صعودی برای مقطعی جلوگیری کرده اند. نکته دیگر در مورد رسم ابزار فیبوناچی ریتریسمنت این است که همیشه از سمت آغاز روند به انتهای روند ترسیم می شود.
Investopedia explains 'Fibonacci Retracement'
Fibonacci retracement is a very popular tool used by many technical traders to help identify strategic places for transactions to be placed, target prices or stop losses. The notion of retracement is used in many indicators such as Tirone levels, Gartley patterns, Elliott Wave theory and more. After a significant price movement up or down, the new support and resistance levels are often at or near these lines
+ نوشته شده در شنبه سی ام دی ۱۳۹۱ ساعت ۱۲ ب.ظ توسط حمید(م) افشاری
|
 زکات علم نشر ان است. برای تریددر بورس و اتی سکه – اونس – سرمایه گذاری در بازار اتی وفلزات – صادرات – واردات احتیاج به علم تجارت الکترونیک وزیر شاخه های ان داریم.